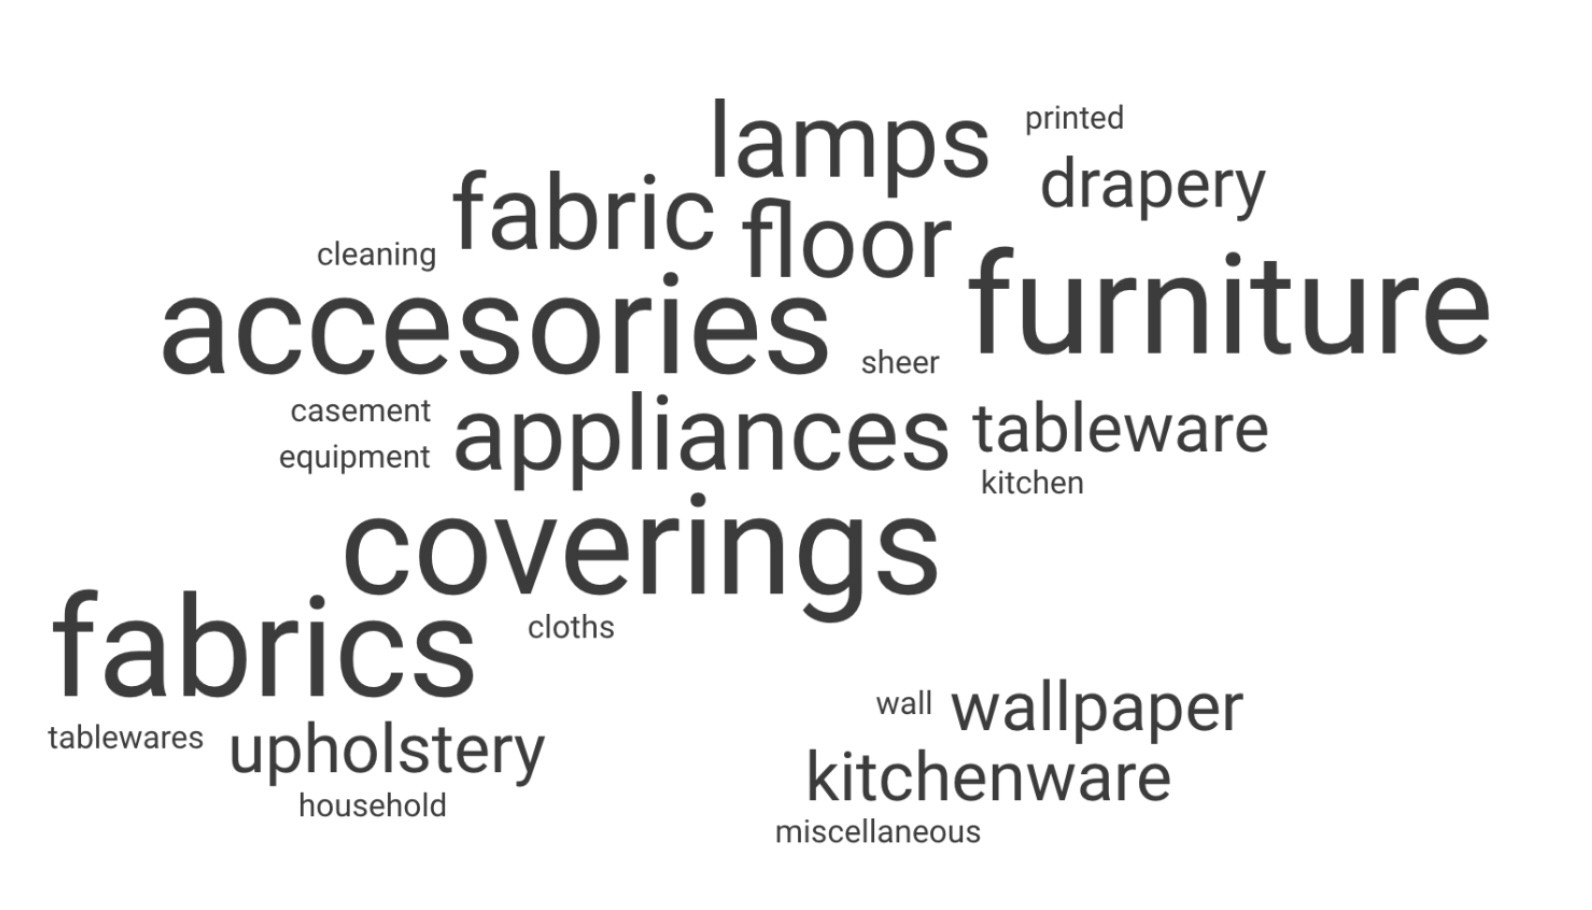
Dec 22, 2025

Metadata Systems

Unstructured Data Processing

ETL Pipeline from PDFs to Dataset

Key Results

  • 816 rows from 5 PDFs → 1093 rows from 2 Normalized datasets

  • 50+ category → 9 controlled categories (82% reduction)

  • 81% biographical enrichment via validated Google API integration

Role & Timeline

  • Data Engineer

  • Fall 2024 (14 weeks)

  • 5 years (1950-1955) extracted from MoMA Archives

  • MoMA Archive Public-access catalog PDF

Approach

  • ETL (Extract, Transform, Load)

  • Python (pandas, regex, requests)

  • OpenRefine

  • Semi-automated wth validation gates

The Challenge

When the tools don't exist, build them.

As an academic researcher studying MoMA's Good Design Exhibition (1950-55), I only have five scanned catalog PDFs for analysis available from the MoMA Good Design website page and archive. I know what tools I need, but none are available: no open-source catalog PDF-to-CSV dataset tools, no structured fields or metadata for exhibition analysis, and no data enrichment options.

Original Optical Character Recognition-scanned catalog where the data was shaped initially. Source: Long Version: The Museum of Modern Art Exhibition Records, 463.19., 494.8., 520.11., 542.4., 570.1.,The Museum of Modern Art Archives, New York. (left) and an enriched analytic dataset as original_catalog.csv (right). Author's copyright.

Data state blocks

OCR issues on variant spellings, e.g., “Arundall Clarke” vs. “Arundell Clarke.”

6–12 category variations per year, preventing systematic comparison

Zero biographical context for the entities for both designers or organizations (nationality, gender, birth/death missing)

Discovery

Design Decision 1#

Semi-Automation Over Full Automation

Accuracy Confidence over The Processing Speed

Data Normalization

Implemented name normalization to identify and merge aliases for each designer (e.g., spelling variants and OCR errors) using OpenRefine clustering—ideal for messy data. This supports OCR automation and mitigates human-like data-entry errors.

Data Enrichment Strategy

The initial dataset extracted from the catalogs included no designer biographical information, yet the analysis required gender, region, and age at the time of exhibition. These became core data fields. Python extraction includes data provenance to improve confidence scoring. The code flags uncertain entries (<95% confidence) for manual review; ~5% of entries required semi-automated validation.

To handle the volume, I designed a priority-based semi-automated workflow.

# Identify which unknown designers to research first based on their item counts

import pandas as pd
import os

def analyze_designer_importance(original_catalog_csv, unknowns_csv):
    """Analyze which designers are most important to research"""
    
    print("\n📊 Designer Priority Analysis")
    print("="*60)
    
    # Read the original catalog with all items
    print("Loading original catalog...")
    catalog_df = pd.read_csv(original_catalog_csv)
    
    # Read the unknowns
    print("Loading unknown designers...")
    unknowns_df = pd.read_csv(unknowns_csv)
    unknown_names = set(unknowns_df['designer_name'].tolist())
    
    # Count items per designer in the original catalog
    designer_counts = catalog_df['designer_name'].value_counts()
    
    # Filter to only unknown designers
    unknown_designer_counts = designer_counts[designer_counts.index.isin(unknown_names)]
    
    # Create priority groups
    high_priority = unknown_designer_counts[unknown_designer_counts >= 3]
    medium_priority = unknown_designer_counts[(unknown_designer_counts >= 2) & (unknown_designer_counts < 3)]
    low_priority = unknown_designer_counts[unknown_designer_counts == 1]
    
    print(f"\n📈 Analysis Results:")
    print(f"Total unknown designers: {len(unknown_names)}")
    print(f"\n🔴 HIGH Priority (3+ items): {len(high_priority)} designers")
    print(f"🟡 MEDIUM Priority (2 items): {len(medium_priority)} designers")
    print(f"🟢 LOW Priority (1 item): {len(low_priority)} designers")
    
    # Show high priority designers
    if len(high_priority) > 0:
        print("\n🔴 HIGH PRIORITY DESIGNERS TO RESEARCH FIRST:")
        print("-"*60)
        for designer, count in high_priority.items():
            print(f"{designer}: {count} items")
            # Show what items they designed
            items = catalog_df[catalog_df['designer_name'] == designer]['items'].tolist()[:3]
            for item in items:
                print(f"  → {item}")
            if count > 3:
                print(f"  → ... and {count-3} more items")
            print()
    
    # Create priority CSV files
    create_priority_files(unknowns_df, high_priority, medium_priority, low_priority)
    
    # Pattern analysis
    analyze_patterns(unknowns_df)
    
    return high_priority, medium_priority, low_priority

def create_priority_files(unknowns_df, high_priority, medium_priority, low_priority):
    """Create separate CSV files for each priority level"""
    
    print("\n💾 Creating priority files...")
    
    # High priority
    high_priority_df = unknowns_df[unknowns_df['designer_name'].isin(high_priority.index)]
    high_priority_df['item_count'] = high_priority_df['designer_name'].map(high_priority)
    high_priority_df = high_priority_df.sort_values('item_count', ascending=False)
    high_priority_df.to_csv('HIGH_PRIORITY_designers.csv', index=False)
    print(f"✅ Created HIGH_PRIORITY_designers.csv ({len(high_priority_df)} designers)")
    
    # Medium priority
    medium_priority_df = unknowns_df[unknowns_df['designer_name'].isin(medium_priority.index)]
    medium_priority_df['item_count'] = medium_priority_df['designer_name'].map(medium_priority)
    medium_priority_df.to_csv('MEDIUM_PRIORITY_designers.csv', index=False)
    print(f"✅ Created MEDIUM_PRIORITY_designers.csv ({len(medium_priority_df)} designers)")
    
    # Low priority
    low_priority_df = unknowns_df[unknowns_df['designer_name'].isin(low_priority.index)]
    low_priority_df['item_count'] = 1
    low_priority_df.to_csv('LOW_PRIORITY_designers.csv', index=False)
    print(f"✅ Created LOW_PRIORITY_designers.csv ({len(low_priority_df)} designers)")

def analyze_patterns(unknowns_df):
    """Analyze patterns in unknown designers"""
    
    print("\n🔍 Pattern Analysis:")
    print("-"*60)
    
    # Organizations vs individuals
    org_keywords = ['Associates', 'Studios', 'Studio', 'Company', 'Workshop', 'Inc', 'Ltd', 'Staff', '&']
    orgs = unknowns_df[unknowns_df['designer_name'].str.contains('|'.join(org_keywords), case=False, na=False)]
    
    print(f"\n🏢 Likely Organizations (not individuals): {len(orgs)}")
    if len(orgs) > 0:
        print("Examples:", orgs['designer_name'].head(5).tolist())
    
    # Quick gender inference
    female_names = ['Mary', 'Helen', 'Dorothy', 'Ruth', 'Betty', 'Patricia', 'Barbara', 
                    'Elizabeth', 'Jennifer', 'Linda', 'Susan', 'Margaret', 'Lisa', 'Nancy',
                    'Karen', 'Emily', 'Sarah', 'Anna', 'Emma', 'Marie', 'Rose', 'Grace']
    
    male_names = ['John', 'Robert', 'James', 'David', 'Michael', 'William', 'Richard', 
                  'Joseph', 'Thomas', 'Charles', 'Christopher', 'Daniel', 'Paul', 'Mark', 
                  'Donald', 'George', 'Kenneth', 'Steven', 'Edward', 'Ronald', 'Carl']
    
    # Check first names
    likely_female = 0
    likely_male = 0
    
    for _, row in unknowns_df.iterrows():
        first_name = row['designer_name'].split()[0] if ' ' in row['designer_name'] else ''
        if first_name in female_names:
            likely_female += 1
        elif first_name in male_names:
            likely_male += 1
    
    print(f"\n👥 Quick gender inference from first names:")
    print(f"  Likely female: {likely_female}")
    print(f"  Likely male: {likely_male}")
    print(f"  Unclear: {len(unknowns_df) - likely_female - likely_male}")
    
    # Nationality patterns
    print(f"\n🌍 Nationality patterns from surnames:")
    patterns = {
        'Scandinavian (-sen, -sson)': r'(?:sen|sson)$',
        'Italian (-ini, -ino, -elli)': r'(?:ini|ino|elli|etti|ucci)$',
        'German (-mann, -stein)': r'(?:mann|stein|berg|feld)$',
        'Dutch (Van, De)': r'^(?:Van |De |van |de )',
        'Irish/Scottish (Mc, Mac, O\')': r'^(?:Mc|Mac|O\')',
    }
    
    for pattern_name, pattern in patterns.items():
        matches = unknowns_df[unknowns_df['designer_name'].str.contains(pattern, regex=True, na=False)]
        if len(matches) > 0:
            print(f"  {pattern_name}: {len(matches)} designers")

def create_smart_suggestions(unknowns_df):
    """Create a CSV with smart suggestions for quick filling"""
    
    suggestions_df = unknowns_df.copy()
    
    # Add suggested gender based on first name
    female_names = set(['Mary', 'Helen', 'Dorothy', 'Ruth', 'Betty', 'Patricia', 'Barbara'])
    male_names = set(['John', 'Robert', 'James', 'David', 'Michael', 'William', 'Richard'])
    
    def suggest_gender(name):
        first_name = name.split()[0] if ' ' in name else ''
        if first_name in female_names:
            return 'Female (suggested)'
        elif first_name in male_names:
            return 'Male (suggested)'
        return 'Unknown'
    
    suggestions_df['suggested_gender'] = suggestions_df['designer_name'].apply(suggest_gender)
    
    # Add suggested country based on surname
    def suggest_country(name):
        if re.search(r'(?:sen|sson)$', name):
            return 'Scandinavia (suggested)'
        elif re.search(r'(?:ini|ino|elli|etti)$', name):
            return 'Italy (suggested)'
        elif name.startswith(('Van ', 'van ', 'De ', 'de ')):
            return 'Netherlands (suggested)'
        return 'Unknown'
    
    suggestions_df['suggested_country'] = suggestions_df['designer_name'].apply(suggest_country)
    
    suggestions_df.to_csv('designers_with_suggestions.csv', index=False)
    print("\n💡 Created designers_with_suggestions.csv with smart suggestions")

if __name__ == "__main__":
    print("Designer Priority Analyzer")
    print("=========================")
    print("This tool helps you identify which unknown designers to research first")
    print("based on how many items they have in your catalog.\n")
    
    # Get file names
    original = input("Enter your ORIGINAL catalog CSV (with all items): ").strip()
    if not original:
        # Try to find it
        files = [f for f in os.listdir('.') if 'complete' in f and f.endswith('.csv')]
        if files:
            original = files[0]
            print(f"Using: {original}")
    
    unknowns = input("Enter your unknowns CSV file: ").strip()
    if not unknowns:
        unknowns = "designers_research_unknown_list_only.csv"
        print(f"Using: {unknowns}")
    
    # Check files exist
    if not os.path.exists(original):
        print(f"❌ Error: {original} not found!")
    elif not os.path.exists(unknowns):
        print(f"❌ Error: {unknowns} not found!")
    else:
        # Run analysis
        high, medium, low = analyze_designer_importance(original, unknowns)
        
        # Ask about smart suggestions
        if input("\n❓ Create smart suggestions for gender/country? (y/n): ").lower() == 'y':
            unknowns_df = pd.read_csv(unknowns)
            create_smart_suggestions(unknowns_df)
        
        print("\n✅ Analysis complete!")
        print("\n📋 Next steps:")
        print("1. Start with HIGH_PRIORITY_designers.csv")
        print("2. These designers have the most impact on your catalog")
        print("3. Research these ~20-30 designers first")
        print("4. The rest can be marked 'Unknown' with less impact")

Focus manual effort: high-priority designers received multi-source validation (MoMA database, Wikipedia, library catalogs, Google search).

Track provenance: added a source field documenting data origin (Known Database, Wikipedia, Not found, Name inference).
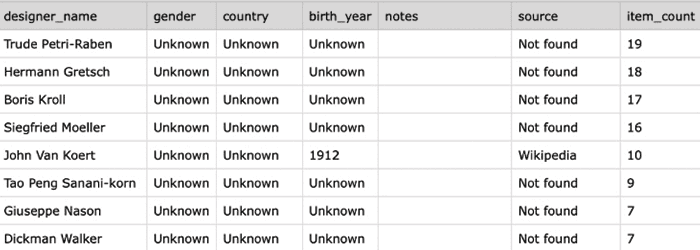
⭐⭐⭐ High priority
⭐⭐ Medium priority
⭐ Low Priority

Strategic resource allocation over a blanket approach: 2 days of semi-automated work focusing on 50+ high-impact designers vs. weeks for perfect coverage of all 276 names (including obscure single-item contributors). Quality gates plus provenance tracking provide transparent data credibility.

81% enrichment rate with documented sources. The remaining 19% is explicitly flagged as "Not found" or "Name inference"; gap transparency enables honest analysis.

Design Decision 2#

Reorganizing exhibition Categories with better Taxonomy
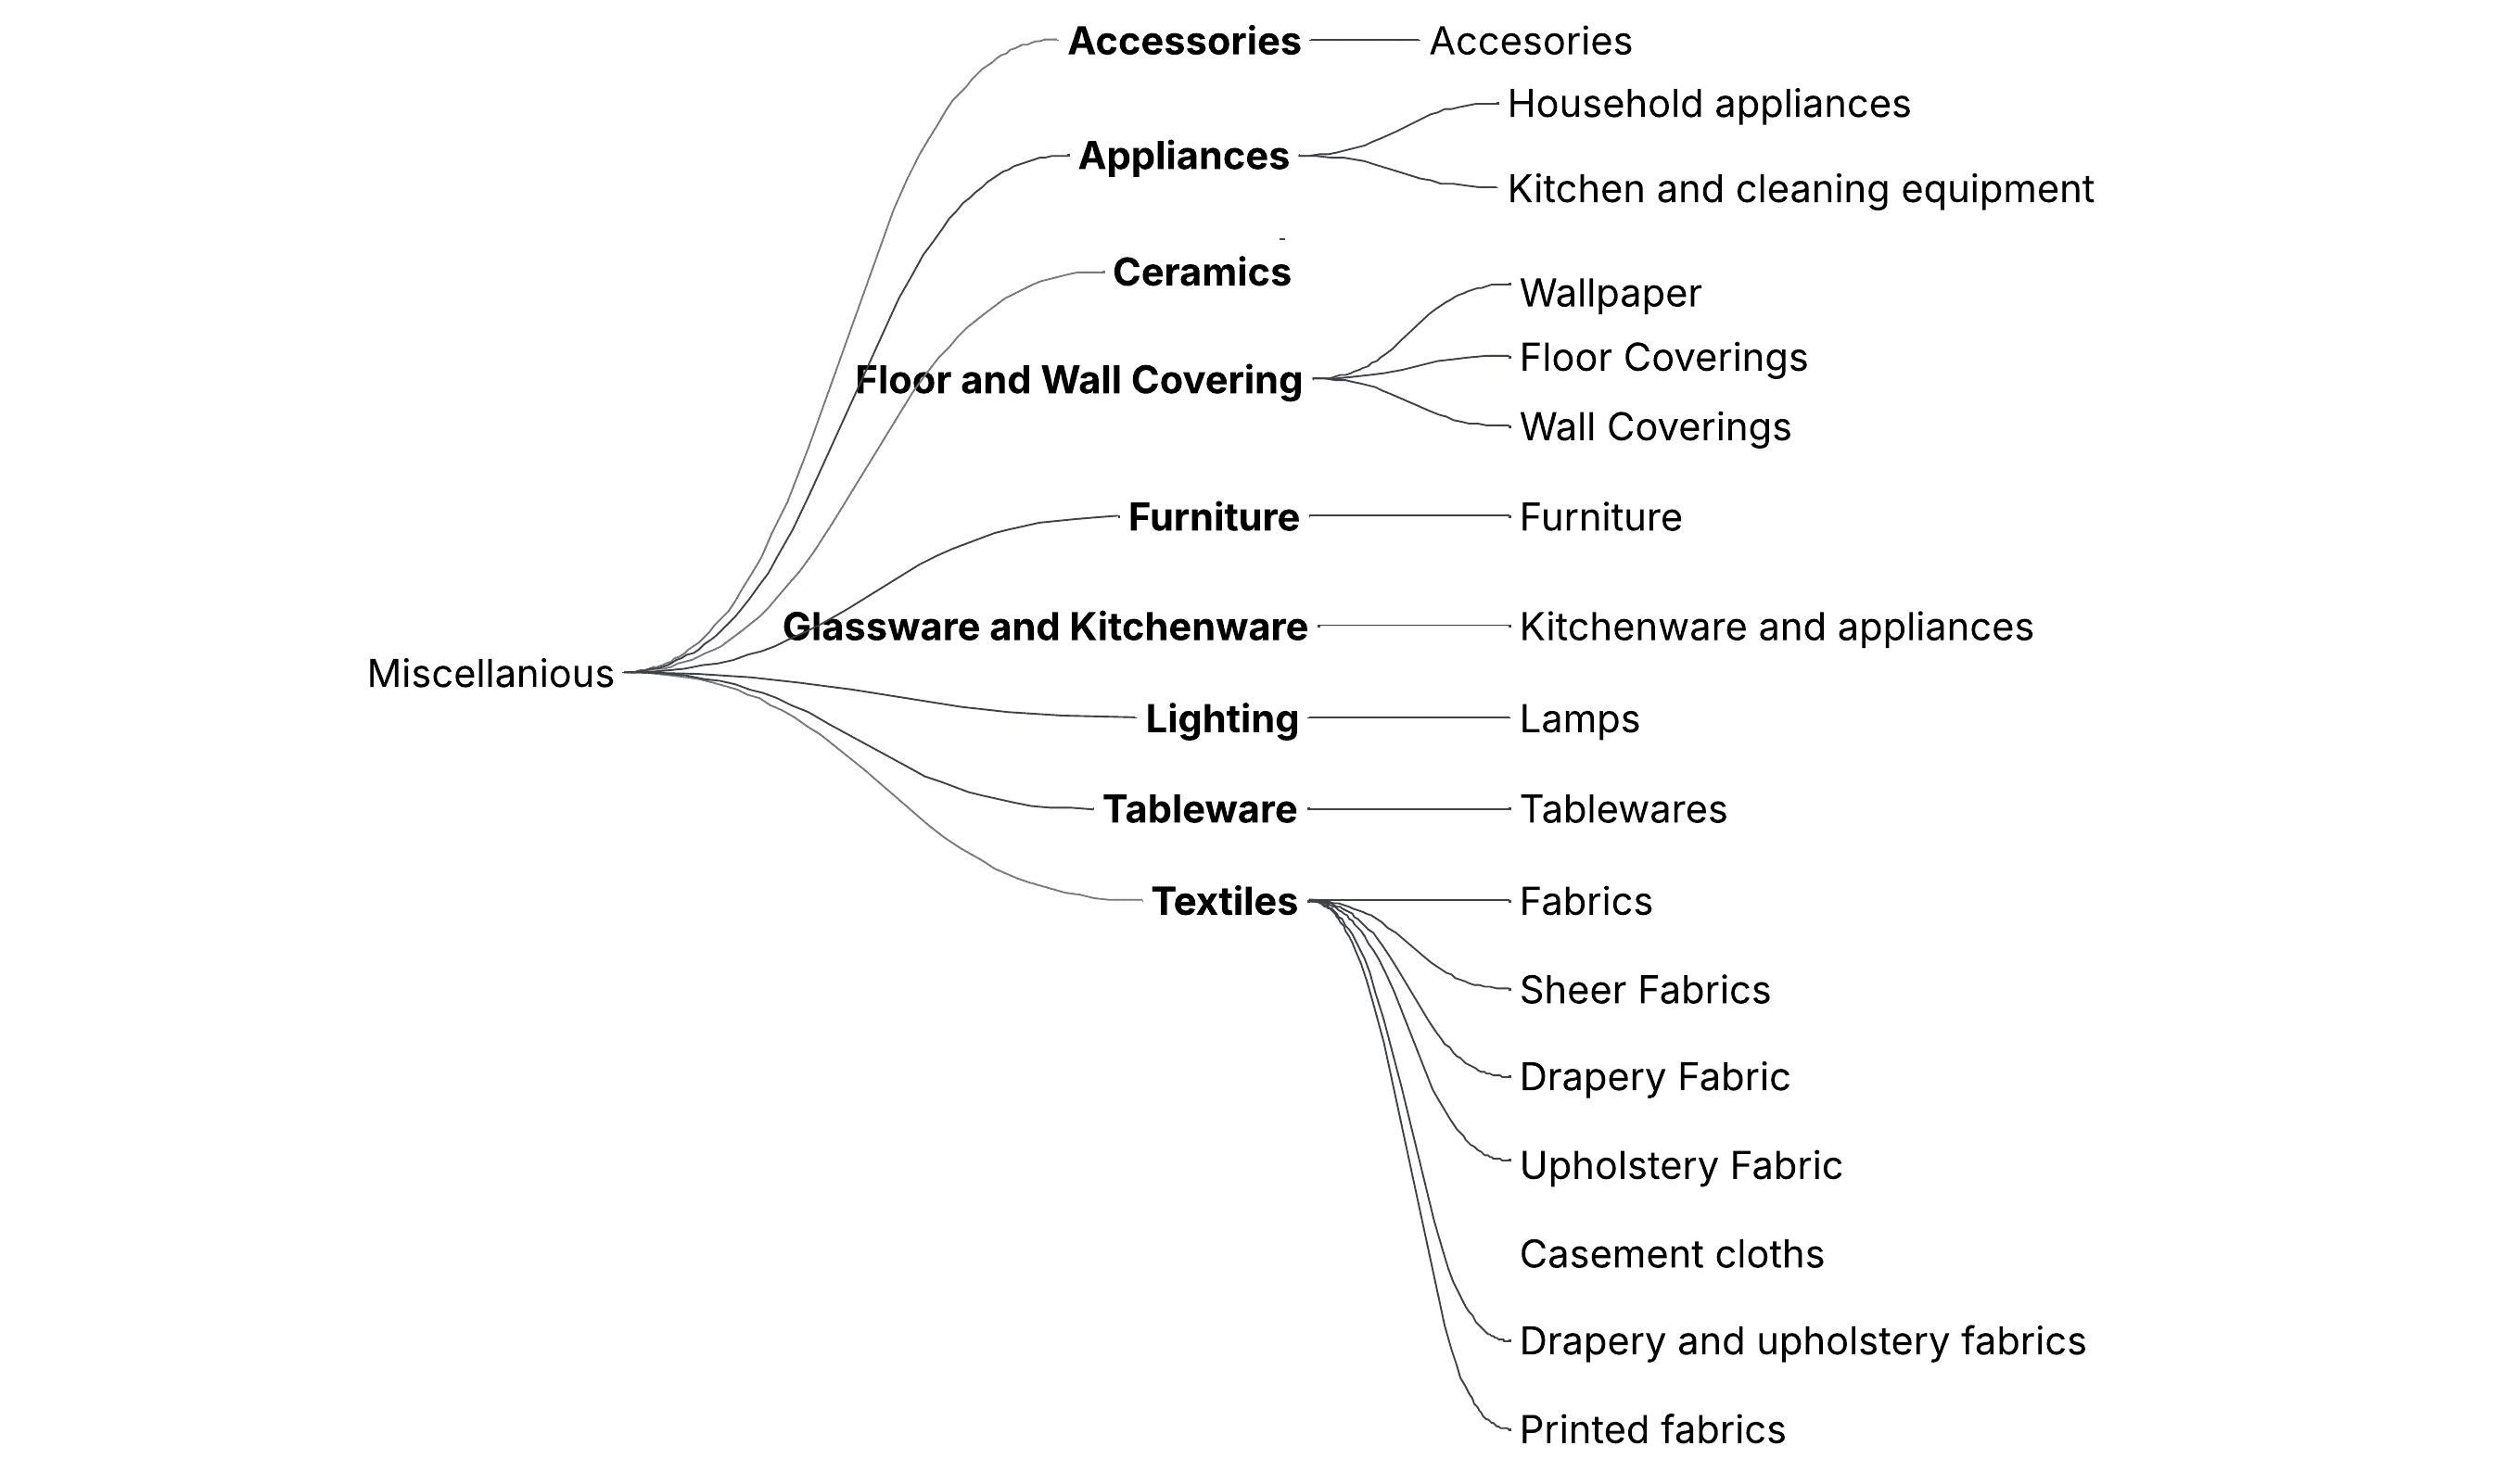
Here is a snippet of the data viz based on this normalization, preserves and improves. Analytical value.

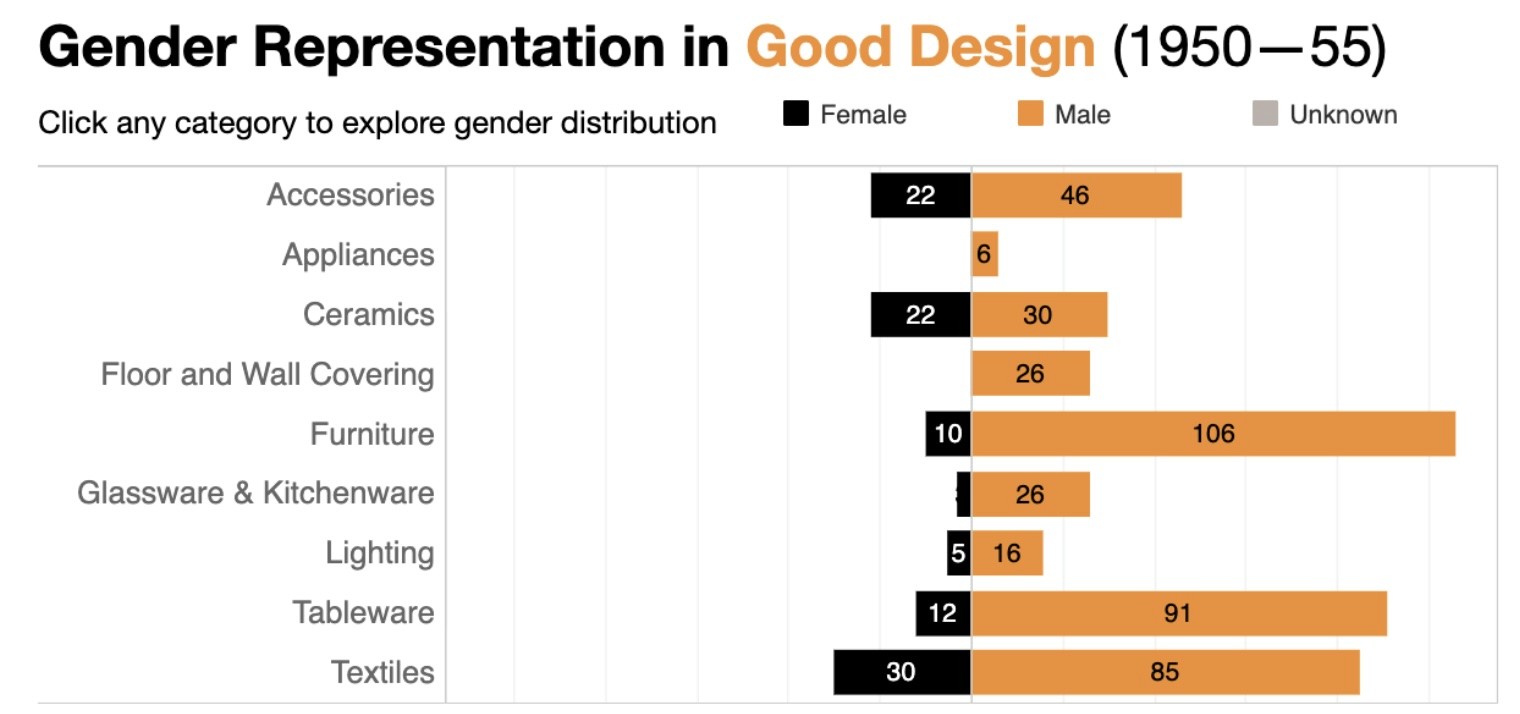
Data Visualization for Item Contribution based on Designers' Gender
Project Outcomes

Framework applicable to museum collections, research institutions, cultural heritage datasets. Anywhere historical catalogs need digitization and data interoperability.

ETL Workflow

Extract, Standardize, Enrich

Semi-automated: algorithms suggest, humans validate. Python + OpenRefine + Google API.

Taxonomy Design

82% reduction

+32 categories → 9 controlled categories. Hierarchical classification, semantic validation, scope definitions, and preventing ambiguity. 

Data Transformation

81% biographical enrichment

Priority-based workflow: high-impact designers (3-19 items) = multi-source validation, low (1 item) = automated. 

Quality Framework

Data provenance /record

Completeness metrics documented (48-100% range). 52% gaps explicit—absence reveals preservation priorities.

Reflection & Learning

This is an independent research project for a class, and it was extended to the Data Visualization Mentorship program by the DataViz Society.

  • Data source: Cleaned from publicly available PDF catalogs, enriched via Google API & Wikidata—not MoMA internal records. Further development would benefit from institutional collaboration.

  • Quality considerations: Semi-manual verification may introduce errors in edge cases. Fuzzy name matching set at >80% confidence threshold—tradeoff between automation and accuracy.

DISCLAIMER

Data Source: The Museum of Modern Art Exhibition Records: 463.19, 494.8, 520.11, 542.4, 570.1. The Museum of Modern Art Archives, New York. Note: Manual data extraction may contain errors and may not fully reflect internal information resources. Personal class project for Data Visualization; additional archival materials not yet consulted. Feedback welcome.

Learn More
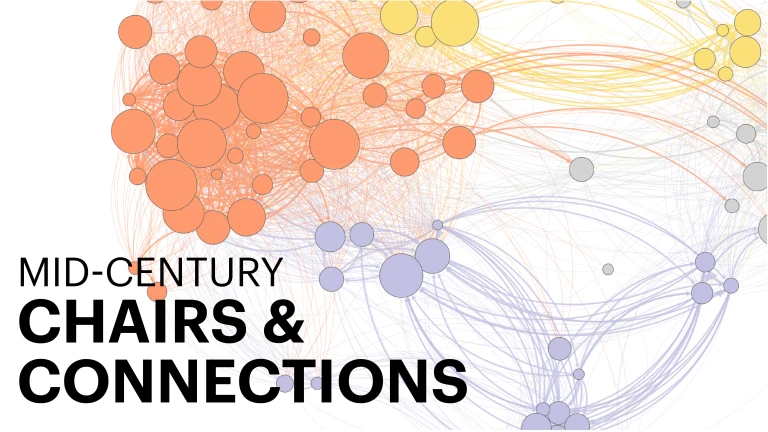
This dataset also supports network graph exploration. The dataset comprises 111 designers from 17 countries, 62 schools, and seven art movements, from the same dataset for the Map Visualization, but enriched with nodes.

Table of Contents

No headings found

Website built on Framer

Copyright ©2026 Kelsey Kiano.

All right reserved.

Create a free website with Framer, the website builder loved by startups, designers and agencies.